What’s behind A/B tests
Well often I’m asked how an A/B test work.
So my first saying, which is the most important thing that I’m going to mention here, is: A/B test is not a simple comparison of frequencies. So don’t ever use the terminology A/B test when you are just comparing 2 numbers, like EVER.
Now that we drew the line let’s go back to the post.
There are several tools around (most of them being embedded in your web BI solution like Adwords, Adobe Site Catalyst, etc), but in fact you don’t really get to understand how it’s calculated.
So here I’ll show (and share in my github account) some methods to do A/B tests.
Using R
Because I don’t have any real life data that I can share, I’m going to use the ToothGrowth dataset from R (please find more details about the dataset here). Basically they treated 60 guinea pigs with 6 variations of treatment and they collected the size of their teeth after a while. Now we are interested in understanding what’s the best treatment.
We can bring this example to any kind of industry that is not medical/health related. For example, let’s say you are running a campaign for sofas and for that you’re using 2 different digital channels: Facebook and Display. But you decided to have 3 types of campaign: a small banner, a big banner and a flash animation. Then you gave 6 variations of treatment just like our guinea pig example.
So going back to our dataset. We have 2 delivery method for vitamin C (Acid Ascorbic and Orange Juice) and 3 different doses – 0.5mg, 1mg, 2mg. This is the reason for the 6 variation. To make it easier (and possible see more in here), we are assuming the the whole dataset has normal distribution.
So first, let’s find out if there’s difference between the delivery methods.
It’s always a good idea to check the stats for A/B sample, like mean and variance. You can find these stats on the bottom of this page
So the first question: is there a difference between guinea pigs that took ascorbic acid and those that took orange juice?
$$H_0$$ Null Hypothesis: $$\mu_{orange juice}$$ = $$\mu_{ascorbi cacid}$$ or $$\mu_{orange juice} – \mu_{ascorbi cacid} =0$$
$$H_1$$ Alternative Hypothesis: $$\mu_{orangejuice} \neq \mu_{ascorbic acid}$$ or $$\mu_{orange juice} – \mu_{ascorbi cacid} \neq 0$$
So in most of the cases, we use the p-value as a comparison for our test. Being higher than 0.05 considered high. If you’re not familiar with the concept of p-value, please check here.
The calculation behind the test is considering our null hypothesis true, what’s the probability of having an extreme value outside of standard variation?
Basically we create a new variable called $$OrangeJuice-AscorbicAcid$$ that has mean as:
$$\mu_{orangejuice} – \mu_{ascorbi cacid} $$ and variance as
$$\frac{S_{orange juice}^2}{n_{orange juice}}+\frac{S_{ascorbic acid}^2}{n_{ascorbic acid}}$$
In a gross way explaining, the number you should calculate is
$$\frac{\bar{X}_{orange juice} – \bar{X}_{acid ascorbic}}{\sqrt{\frac{S_{orange juice}^2}{n_{orange juice}}+\frac{S_{ascorbic acid}^2}{n_{ascorbic acid}}}}$$
That has T-distribution if $$n_{orange juice} + n_{acid ascorbic} < 40$$ and Normal distribution otherwise.
Back to our test, first we filter the variables by Ascorbic Acid (VC) and orange juice (OJ)
vc_subset oj_subset
then we can apply the t-test
t.test(vc_subset$len, oj_subset$len)
Which results into
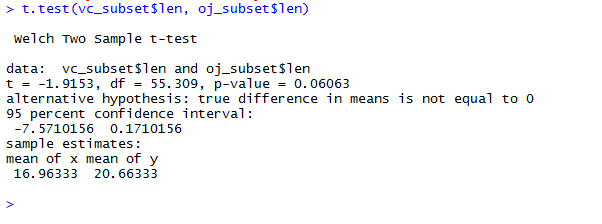
P-value is higher than 5% so we decide against the null hypothesis.
The rest of this dataset analysis you can see in the github repository that I shared in the bottom of this post.
Now assuming we have 2 campaign running using different templates.
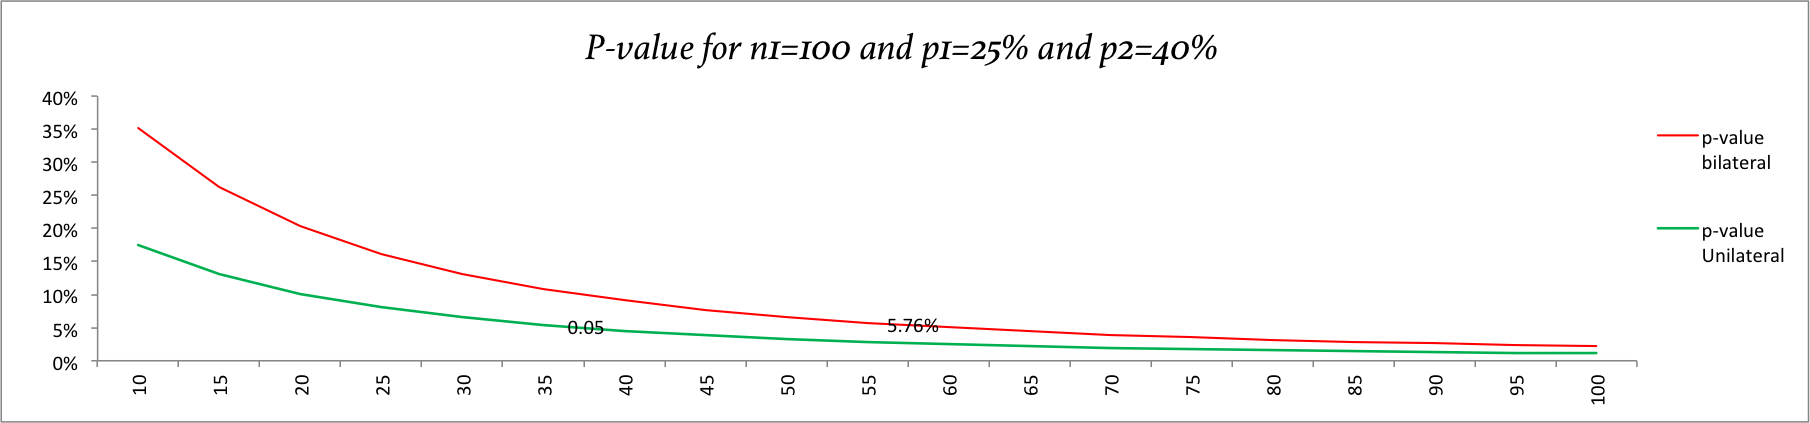
For the first campaign the click through was 25% and for second one the click through was 40%. It’s hard to tell with only these two piece of information if there’s difference between the campaign. For example, let’s say that the first campaign we have 100 people seeing it, while the second one only 10. Even having a much higher click through rate, the second campaign has a very low number of impressions and it’s hard to say if there’s difference between them.
In the chart below you can see that we have to show to at least 55 people keeping the 40% to say that the there’s difference between the samples. And at least 40 to conclude that the campaign 2 is better than the campaign 1.
Currently there are several links that can be used to do an A/B test, such as:
- https://vwo.com/ab-split-test-significance-calculator/
- http://www.hubspot.com/ab-test-calculator
I’m also uploading a spreadsheet with the proportion and the mean tests here.
And for more information about how to implement t-tests in R please access this link